Element_PI.PersDiagram
-
Element_PI.PersDiagram(lifetime=True, showplot=True)¶ Creates a visual representation for a persistence diagram
- Parameters
xyz (string) –
Name for local file containing data on coordinates representing atoms in compound
lifetime (bool, optional) –
Option to set the y-axis to lifetime value
- Options:
True: set coordinates to (birth, death - birth)False: set coordinates to (birth, death)
showplot (bool, optional) –
Option to output PD plot automatically to screen or not
- Options:
True: show plotFalse: do not show plot
- Returns
rips (Rips object from the ripser module) –
See ripser documentation for this return value.
This object has the data specified in xyz fit to it.
Note
If
showplot = True, then a plot of the PD will be output to the screen.
Example
In the example below, we will show how to create a persistence diagram and output
it to the screen. We will use the file babel/1.xyz which contains coordinate
data on the atoms in the pyridine compound.:
import Element_PI
filename = 'babel/1.xyz'
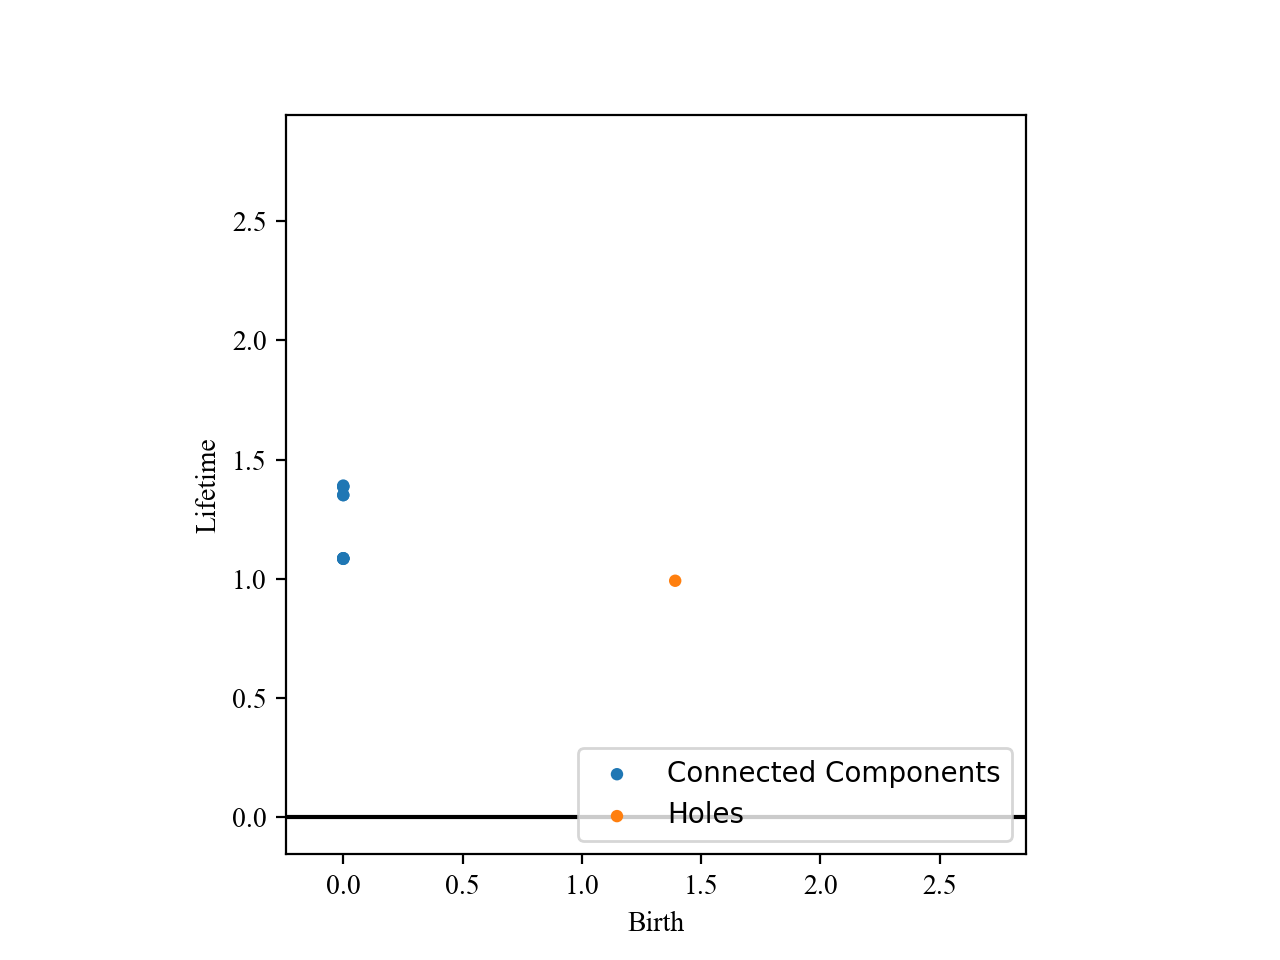
Element_PI.PersDiagram(filename, lifetime = True, showplot = True)
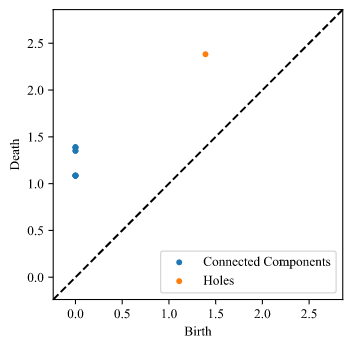
If we specify lifetime = True (as above), then our plot will look like the
following. This plot represents the PD that is used to generate the PI.:
If we specify lifetime = False, then our plot will look slightly different.: